

Teachers always want the best for their students. And to an extent, they ask themselves, “What more can I do for my students to provide them with the best learning experience?”
Discovering solutions for different learning situations is more than just figuring out what feels right. Teachers cannot simply make conclusions based on their gut feeling. To provide comprehensive insights, one must collect, extract, refine, and analyze data to make informed decisions, which is something that even teachers should know.

This is where data analytics becomes vital in the classroom. It mainly involves analyzing raw data to draw insights and use these to solve problems. But to understand the analytics, teachers must be familiar with the data value chain, or the journey of data from its creation to how they can use it to drive actions and decisions in different contexts, such as in Filipino classrooms.
Here’s how data analytics can be a transformative tool to solve various classroom problems.
Understanding the data value chain
According to Sherwin Pelayo, the Executive Director of the Analytics Association of the Philippines (AAP), the data value chain is a process that starts from the ‘birth’ of the data, wherein it is created and generated from its source. These are collected and consolidated into a single repository which transforms into information.
Then the information is converted into insights. They can draw patterns from this stage since similar data from the past was also stored in the repository. Questions such as ‘Why did it happen?’ and ‘What is likely to happen next?’ can be answered based on the emerging trends from data.
Below is the data value chain from Getting Grounded on Analytics Course – Data Value Chain for reference.
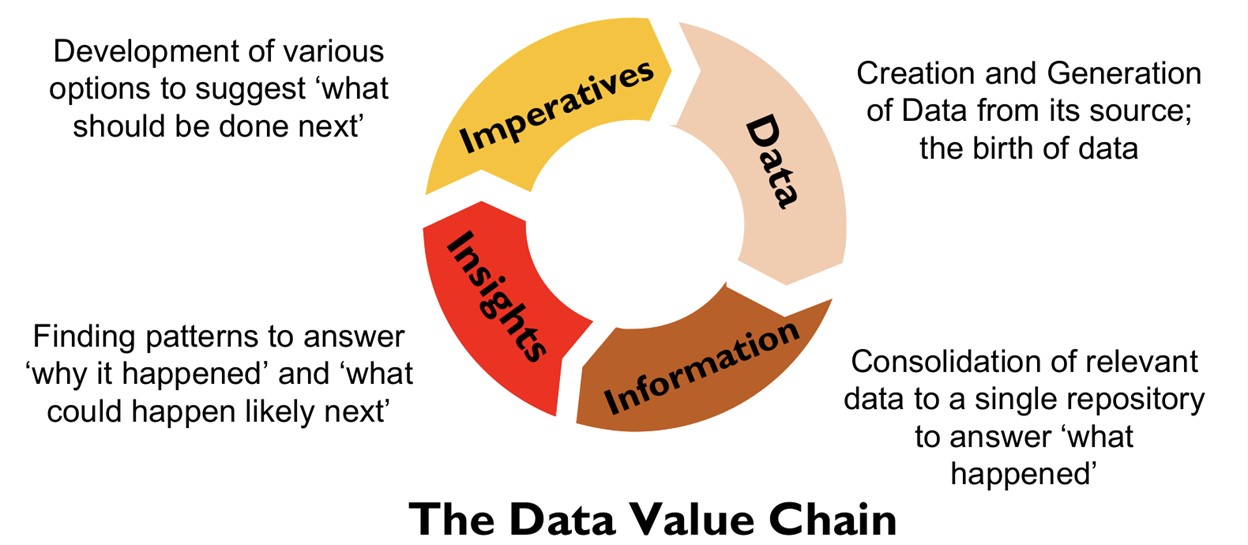
Finally, the insights turn into imperatives or actionable insights. This part should answer the question, “What should be done next?” It is essential to know that these insights would be wasted if teachers do not use them to take a considerable course of action. Overall, this process can enable teachers to answer a problem or do something better.
Application of data value chain on classrooms and its reality
Classrooms are rich in data because of the assessments, activities, projects, and performance tasks that happen inside. From these, teachers can gather the results and consolidate them into a class record. Traditionally, these records will act as the teacher’s guide to grasp the situation. However, while these data are graded and computed, it is mere numbers staring back at teachers, and no comprehensive insights are often derived.
Comprehensive insights are vital to derive a perfect solution to improve the learning experience for students. However, analyzing information is often ignored in the country’s education system because teachers must finish their grading sheets while handling multiple students. This is the problem with the traditional process of handling data in the classroom, which genuinely limits the capabilities of teachers to nurture the students.
The reality is teachers can only do so much. While they strive to give the best for their students, they cannot do that if they are bound to perform on a system that burdens them to check an enormous amount of class activities and exams, all for the sake of putting numbers on class cards. That is why it is time to gear away from the traditional process and empower them to become data-driven teachers using an innovative edtech platform.
Quipper as a tool to become a data-driven teacher
The data for each student is essential to weigh the student’s performance. Luckily, Quipper offers quick generation and storage of students’ assessments due to its innovative features. They can save these data anytime, so teachers won’t have to worry about misplacing students’ papers.
One is the Q-Link portal, which can access students’ performance analytics. The Statistics feature shows each student’s detailed progress, performance, and engagement with the material assigned or uploaded. The data can be downloaded as a CSV file (spreadsheet format) accessible anytime. With this, teachers may print the data as paper copies necessary for grade discussion or copy-paste the student records to their master spreadsheet for grading.
From this data, they can draw insights that determine the student’s performance patterns. For example, the Assignment Analysis tab automatically gives remarks to every percentage score of the assignment so the teachers can view which students “Needs help,” “Satisfactory,” and “Excellent.” Therefore, teachers can see which students are having trouble mastering the topic, which they can pay attention to in the next class session.
Another benefit the platform could give is that the data teachers can get from it can help them create differentiated and personalized learning for students. These two principles allow students to design their learning path based on their interests and style, and teachers can adapt the lessons based on the different types of learners.
Lastly, Q-Link also automatically reports the analysis of every question in the given test to the teachers. The Success Rate in the Assignment Analysis tab provides how many students got the correct answer in every item in the exam or assignment and its equivalent percentage. Thus, teachers can see which items should be discarded due to their difficulty and which item should remain or improve with just a click.
Overall, data is vital for a more comprehensive learning experience for students. While there are still challenges in the system that need to be addressed, becoming a data-driven teacher is a massive step toward making education conducive for all learners. Luckily, Quipper is here to aid teachers and become their partner because the platform can help them maximize all the automatically gathered data to improve their practice and their students’ performance.
To learn more about Quipper Philippines and its other programs and initiatives, visit https://www.quipper.com/ph/
About the Author:
Jade Hizon finished an undergraduate degree of Bachelor of Secondary Education Major in General Science (Nueva Ecija University of Science and Technology) and a master’s degree of Master of Science in Biology Education (Central Luzon State University). He also represented the Philippines in the 2018 ASEAN Data Science Explorers (ADSE) competition, together with John Rusty Pereña, which they won the first runner-up. He is currently a licensed professional teacher and the Community Engagement Lead of Quipper.
Sources:
[1] Pelayo, S. (2019, May 1). Getting Grounded on Analytics. https://www.linkedin.com/pulse/getting-grounded-analytics-sherwin-pelayo/
[2] Development Academy of the Philippines (2020). Getting Grounded on Analytics-Data Value Chain [Lecture Video]. Coursebank. https://coursebank.ph/courses/course-v1:DAP+SP101+2020_Q1/about

